

There are two useful tools for valuing and comparing the feasibility of real estate investment opportunities: the capitalization rate (Cap Rate) and the cash-on-cash return.

The two metrics use a snapshot of annual pre-tax income as a basis to determine the value and evaluate the feasibility of real estate income properties in comparison to other investments of comparable risk.
CAP RATE
The cap rate is an investor’s return on investment for an asset purchased with no debt. The cap rate is a great tool to compare the relative value of one property to another.
The cap rate is calculated by taking the annual gross income generated by the property less all operating expenses (excluding principal and interest on any loan payments) divided by the purchase price.
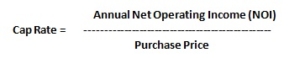
For example, a property generates $60,000/year NOI. The comparable sales in the market show an average 5% cap rate, using the $60,000 NOI divided by the 5% cap rate equals an estimated value of $1,200,000.
Alternatively, for example, a property generates $35,000/year NOI with a purchase price of $500,000, results in a 7% cap rate. Compare that to a building of similar size/location generates $25,000/year NOI at the same $500,000 purchase price results in a 5% cap rate. Clearly the building with a higher NOI or cap rate with all other factors being equal is a better investment.
CASH-ON-CASH RETURN
The cash on cash return is a rate of return ratio based on the net cash investment in the property. It’s a simple metric to show the real return on the actual cash one invests in the property for the year. The cash-on-cash return is calculated by taking the gross annual income less all operating expenses including the principal and interest payment on the debt divided by the actual out-of-pocket cash invested in the property (this excludes the debt).
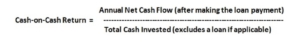
For example, a property that generates gross revenue, less operating expenses, and debt service (principal and interest payments on the loan), for a net cash flow of $10,000/year, divided by the total cash invested out of pocket including fees of $100,000, results in a cash-on-cash return of 10%.
Cash-on-cash allows an investor to better evaluate the performance of an investment given the exact out-of-pocket investment. Often investors purchase under performing properties that at the time of acquisition generate a lower cash-on-cash return than its real potential, thereby giving the investor an opportunity to increase net income and generate a higher cash-on-cash return.
For example, if the investor believes the net cash flow can be increased from $10,000/year to $15,000/year divided by the gross cash invested (excluding debt) of $100,000, it results in a cash-on-cash return of 15%. A potential reason to consider this investment is the possibility of increased income and therefore, increased cash-on-cash return
CONCLUSION
Several factors that affect the valuation and feasibility analysis of an asset not included in the cap rate or cash-on-cash return are future potential changes in property value and tax implications, i.e., the non-cash expense of depreciation. Though these factors may be missing in the ratio analysis, the relative use of these simple metrics makes them excellent tools for valuing and comparing real estate investment opportunities.
In theory, cap rates and cash-on-cash returns correlate with risk, the higher the returns, the more risk there is in generating the return. However, when there are inefficiencies in the market due to timing, owner circumstances and preferences, and unique aspects to properties where value can be added, there is the opportunity to achieve higher returns without higher risk.
Are you aware of these tools? And if so how have you used them in your own investment analysis?